| <<voltar |
PESQUISA > Peixe elétrico, caramujo e mamíferos > Link 12 > |
Key words. Cortical mapping, Somatic sensory, Agoutis, Rodents, Sulci,Brain-behavior specialization
Abstract of somatic sensory cortical regions of agouti
The localization and organization of primary (SmI) and secondary (SmII) somatic sensory
cortical regions in agoutis, have been studied with microand macroelectrode-evoked
potential techniques. For SmI, the mean surface area determined using microelectrodes was
130% smaller than that obtained using macroelectrodes. The location and organization of
SmI are similar to those of other rodents: the largest representations were those of the
vibrissae, the perioral regions and the first digit of the hand. As in some other animals,
SmII is related to both sides of the body. It shows excellent somatotopic differentiation
and was located lateral and posterior to SmI, in relation to which it is arranged as a
reduced mirror image. The area of SmII represents 31% of that of SmI in agoutis. The large
size of the forepaw representation in SmI is reflected in SmII, that of the face
representation is not; this agrees with similar findings from several other species. SmI
was completely mapped using light touch stimuli, and contains many projections from
vibrissae and hairs along with some proprioceptive projections. SmI overlaps with visual
projections. SmII receives less light touch, vibrissae and hair projections than SmI, and
it receives numerous deep mechanical and auditory projections. In SmII latencies were
10.96msec for somesthetic and 13.39msec for auditory stimuli; in SmI latencies were
13.25msec for somesthetic and 39.80msec for visual stimuli. One sulcus separates the SmI
projections of the forelimb from those of the hindlimb, and another is often found marking
the posterolateral boundary of SmII.
Introduction of somatic sensory cortical regions of agouti
The two somatic sensory regions, particularly the ‘primary’ (SmI), are quite well known since the 1950s for a large number of mammalian species [Mounicastle, 1968 ; Woolsey, 1958]. The’secondary’ area (SmII) was first described later than SmI for cats and ungulates [Adrian, 1940, Woolsey and Fairman, 1946]; and more completely for dogs [Pinto-Ha-mtty et al., 1956], porcupines [Lende and Woolsey, 1956] and squirrel monkeys [Benjamin and Welker, 1957]. Since in all of the studies of SmII, macroelectrodes were used, they did not show a fine somatotopic localization of projections. The trunk representation, which is very im-portant for the general somatotopic orientation of the representation of the whole body surface, was poorly localized. (Cortical mapping with evoked potential technique using macroelectrodes yields for both SmI and SmII at best a rough somatotopy and large receptive fields.) In more re-cent studies, more restricted receptive fields have been found for SmII and for SmI using microelectrode techniques [Carreras and Andersson, 1963; Haight, 1972; Werner and Whitsel, 1973]. Haight [1972] reported that the SmII representation for cat is reversed from that previously sug-gested [Wool.<ey, 1958]; and similar results were obtained in sheep [John-son et al., 1974], raccoons [Herron, 1978] and llamas [Welker et al., 1976]. Berman [1961a, b] described a detailed overlap between SmII and auditory area, using techniques with macroelectrodes and paired stimuli in cats, but no ‘inversion’ of the body representation was detected in SmIl. Welker and Sinha [1972] analyzed SmII in rats using microelec-trodes also without noting the ‘inversion’ but the region is very small in the smaller rat brain, and finer details were not found even with micro-electrodes.
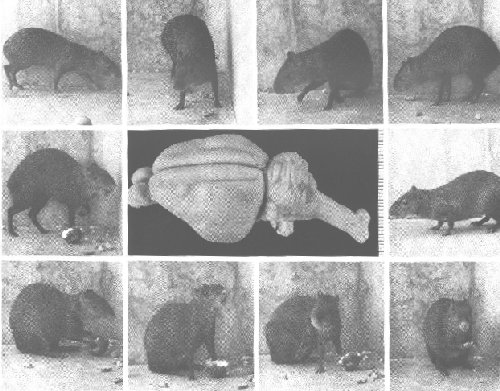
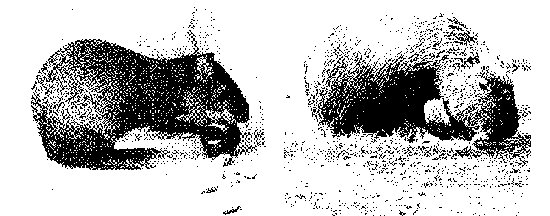
Agoutis are large rodents, with large brains showing some cortical convolution (fig. I), thus they are advantageous subjects for studying fine details of sensory projections in a rodent. The purpose of this work was to study the somatic sensory cortex of agoutis using microclectrode techniques, to compare sensory projections in agoutis with those of other rodents and of mammals of other orders, and to investigate the overlap between SmII and auditory area by application of paired stimuli. This study is an extension of an earlier investigation of the somatic sensory thalamus in agoutis [Campos et al., 1972]. Two preliminary notes have appeared previously [Pimentel-Souza et al., 1973; Cosenza et al., 1974].
Materials and Methods of somatic sensory cortical regions of agouti
10 agoutis, Dasyprocta aguti, of mean body weight of 2.47+0.09 (kg+SE) were used to map SmI and SmII in whole or in part. The animals were anesthetized by dial-urethan (144mg dial/kg body weight and 241mg urethan/kg, administered intraperitoneally, lP) preceded by a (tranquilizer (chlorpromazine 5 mg/kg intramus-cularly, IM). Care was taken to produce anesthesia not too deep to prevent mapping the secondary area (SmI1). All animals had the trachea cannulated; atropine sulfate (0.25 mg/kg) was injected IP and hydrocortisone (5 mg/kg) was administered IM to minimize surgical shock. The skull was exposed and fixed by means of brass bars, screws and dental acrylic; the cortex was exposed and protected with warmed min-eral oil contained by a dam of dental acrylic. Rectal temperature was maintained between 35 and 390C. After experiments, the animals were perfused transcardially with 0.9% saline followed by 10% formal-saline.
Neural responses were preamplified X1,000 and monitored audibly through a speaker, and visually on an oscilloscope, in the first 2 animals, responses were recorded with 0.smm diameter stainless steel wire (macroelectrodes) and in all the other animals penetrating tungsten microelectrodes (15-60 m m of the tip exposed and 1-15pm diameter) [Johnson et al., 1974] were used. the neural response recorded by macroelectrodes consisted of a ‘slow wave’ change in cortical potential, the traditional ‘evoked potential’ response [Berman, 1961b]; while microelectrodes yielded both evoked slow waves and ‘unit cluster’ activity [Johnson et al., 1974] in response to stimulation.
The experiments for mapping SmI and the first 3 animals for SmII used only low threshold stimulation; light skin touch and/or hair movements. In the subsequent 4 animals higher threshold stimuli were also applied such as deep touch (sharply tapping the skin), after first checking skin touch responses. Acoustic stimuli were also applied some times. To be sure the touch response was not due to vibratory or acoustic stimulation conducted through bone to the ears, 5 V/10 msec electric shock was delivered subcutaneously through an isolation transformer and a chiselled coaxial electrode. (tare was taken not to confound deep cutaneous stimuli with excitation of muscle receptors, by moving the skin relative to muscles and noting whether the receptive field moved with the skin. There were totals of 119 macroelectrode and 31U microelectrode placements. For the microelectrode maps, in SmII 212 points were needed, including 54 mostly unresponsive points for determining limits. Points were generally recorded 2 mm apart, and I mm apart in boundary regions; for Smll 98 points were needed, including 20 unresponsive placements and 21 limiting responses from SmI, recorded in three complete limited Smll experiments, in which low and high threshold stimuli were applied. In the three initial experiments devoted to mapping SmII, only low threshold stimuli were applied and only 15 evoked responses were recorded.
Results
Somatic Sensory Region SmI of agouti
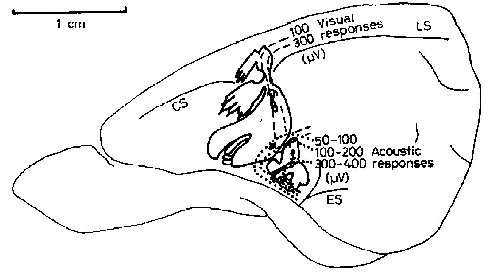
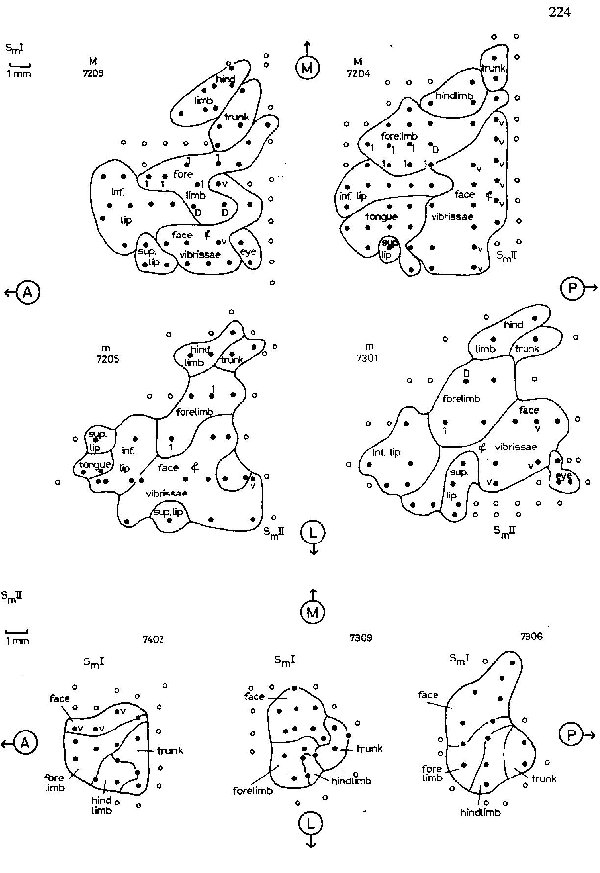
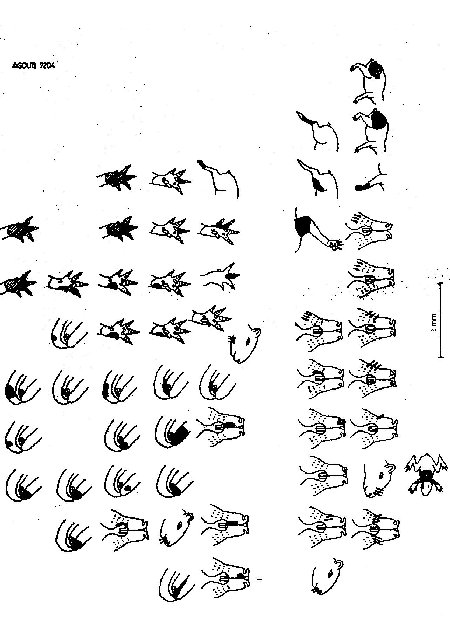
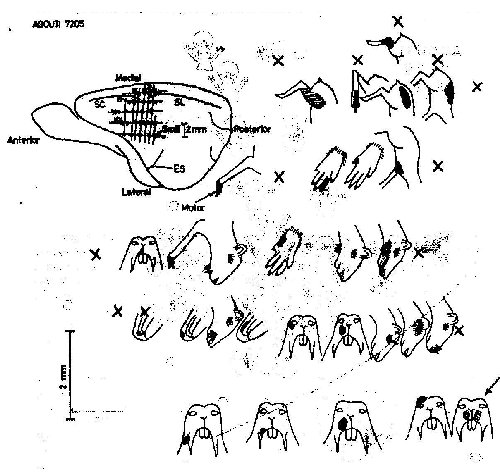
The location and organization of region SmI in the agouti is shown in figure 2. It does not reach the midline of the brain (the apex of the hemisphere). The forelimb representation is greater than the hindlimb and the majority of SmI is a representation of the face. The coronal (CS) and lateral (LS) sulci [Friant, 1945] seem to separate the representations of the trunk and the hindlimb from those of the head and forelimb. Projections of the trunk and hindlimb are found medial to the sulci, with the representation of the distal limb rostral to that of the trunk. Just lateral to the sulci is the representation of the shoulder and forelimb, again with the limb apex represented rostrally, and a large representation of the first digit located most anterolaterally. Small representations of the dorsal surface of the forepaw, not shown in figure 2, were found medial and lateral to the volar forepaw representation. Posterior and lateral to the forelimb representation are projections from the posterior portions of the face and head. Extending lateral and anterior from these are large representations of the mystacial vibrissae, the rhinarium, and the lips.
Most anterolaterai in the sensory region are a small representation of the palate and the upper incisors, and a larger representation of the tongue. Many of the projections from palate, teeth and tongue appeared to be bilateral, otherwise all pro-jections encountered in SmI were from contralateral fields.
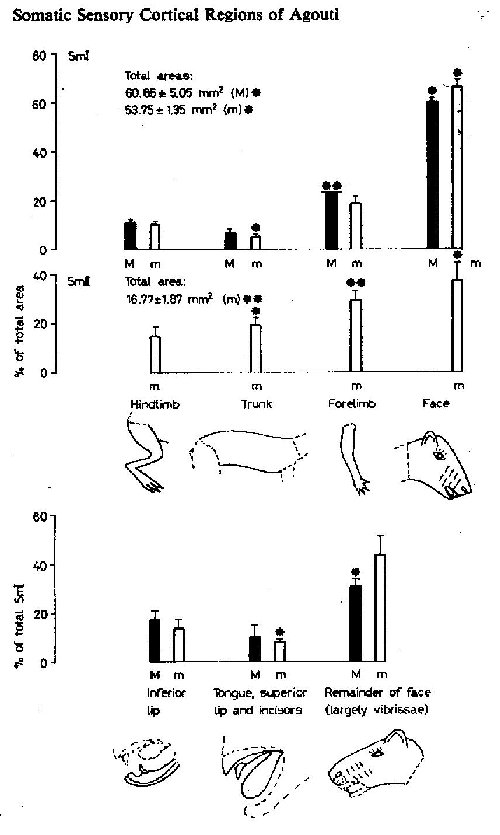
The proportional extent on the cortical surface, of projections from various body subdivision are shown in figure 3, along with the mean total areas of SmI and SmII. The areas of each subdivision of SmI have coefficients of variations of the mean which are greater than that for the whole SmI region, probably indicating that there are greater interindividual or intersample variations in the subdivisions than in the total SmI region. In both micro- and macroelectrode experiments, there was an overlap between somesthetic and visual responses in 24°% (mean of four experiments) of the responsive points (evoked slow waves of at least 100m V amplitude peak), In the posterolateral corner of SmI, about 6% of responsive points also yielded discrete auditory responses (fig. 2). The mean response latency evoked potentials for the whole SmI was 13.25±1,22 msec (mean+SE, 12 placements) and for the overlapping visual stimuli 39.80+0.65 msec (15 placements) sampled in four experiments. Low threshold stimuli were sufficient to map SmI (97% of placements); hair movement accounted for only 14.5% of these low threshold stimuli. Two responses to joint movement were recorded in SmI.
Somatic Sensory Region SmII of agouti
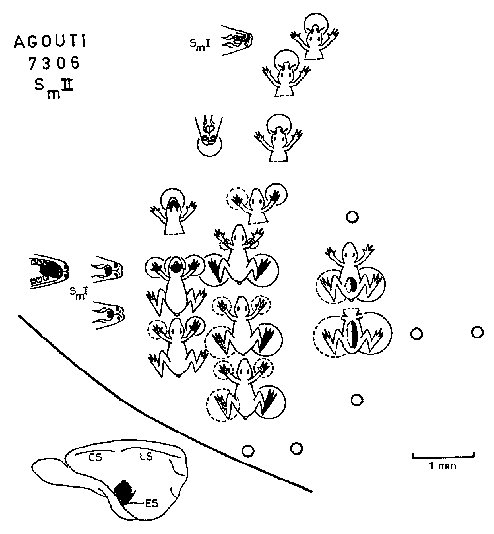
Most SmII responses studied were evoked slow waves and were activated by bilaterally symmetrical receptive fields. SmII showed a clear somatotopic organization, SmII receptive fields were restricted even for deep stimuli (fig.4), However, in some experiments projections of the body to SmII are organized as the body shape of the animal in a less distorted manner than are those to SmI. SmII is in overall orientation like a reduced mirror image of SmI (fig.2). The general location and orientation of SmII in the cortex seems also quite constant. SmII is limited posteriorly and laterally by vessels under which lies the ectosylvian sulcus [Friant, 1945] when present.
Responses evoked by stimulation of different sensory modalities (hair, skin, deep touch, and auditory) were investigated more systematically, In any one penetration, we evoked responses to one, two or three modalities of stimulation. We never found responses to acoustic stimulation alone. All other possible combinations were observed, In SmII no responses to joint movement were recorded.
Low threshold stimuli activated only 35% of responsive points. Hair and vibrissae projections were much less extensive in SmII (15.8%) than in SmI (52.3%) and were situ-ated in Smll nearer Sml than were responses to postcranial stimulation. The greater part of SmII yielded deep touch (65% of responsive points) and auditory (44%) responses and they almost always overlapped in the posterolateral part of SmII. Occasionally, to check whether both modalities activated the same point, we applied paired stimuli according to Berman’s technique [Berman, 1961a, b]. A typical recovery cycle of responses between a deep touch stimulus on the contralateral foot (as represented by an iterative electric stimulus of 10 msec duration and a frequency of up to 12 pulses/see) and an auditory stimulus in the animal 7306 is shown in figure 5. This diagram shows that the earliest responses to a sec-ond stimulus were obtained using two stimuli of different modalities. When two stimuli of the same modality were paired, the response for the second stimulus appeared only when the two stimuli were separated by a greater interval of time. Ipsilateral deep touch responses habituated soon-er than contralateral ones. As a control for the effect of a single auditory stimulus, the response to the stimulus was masked by a hand clap.
Mean latencies of cortical evoked potentials for SmII increased significantly to stimulation of the more distal parts (table I). ‘total contralatera( latencies were significantly shorter (p<0.001, Student’s t test) by about 6 msec than total ipsilateral ones (table I) and shorter (but not statistically significant) by about 2msec than total contralateral values for SmI. Mean latency for auditory evoked potentials overlapping SmII was 13.39 +0.64 msec (28 placements).
Discussion
The somatic sensory regions in the neocortex of agoutis show an in-teresting enlargement of forelimb projections as well as the usual face specialization scen in the cortical projections in other rodents. In SmII, the orientation of projections, the differential extent of projections from the body and limbs compared with those from the face, and the bilaterali-ty of projections are of special interest for the general problem of the function of SmII in mammals. The question of slow wave responses, re-lated both to the bilaterality of receptive fields for SmII responses, and to the overlap of response fields of stimuli of different modalities, also mer-its attention. In the modestly convoluted agouti brains, the pattern of sul-ci shows some relation to the ordering of sensory projections.
Sml Region of agouti
The large portion of SmI devoted to projections from facial regions is typical of herbivores, e.g. capybaras [Campos and Welker, 1976], sheep [Johnson et al., 1974], porcupines [Lende and Woolsey, 1956], rabbits and pigs [Woolsey and Fairman, 1946], guinea pigs [Zeigler, 1964], and llamas [Welker et al., 1976]; and is probably functionally related to the animals’ needs for fine, fast and accurate tactile discriminatation in the selection and manipulation of food. The agouti is unusual in having a large forelimb representation.
As pointed out in an earlier study of mechanosensory projections to thalamus [Campos et al., 1972], agoutis use the forepaw in their food-discriminating and manipulating activities: they hold, sort, peel and otherwise dissect food items, using forepaws and teeth. This use of the forepaw is very probably related to the proportion of sensory cortex occupied by the forepaw representation, which seems to be much larger in agoutis than in any of the other herbivores mentioned above. Interesting comparisons which support his hypothesis can be made with capybaras, another large hystrico-morph rodent having a larger and more convoluted brain. In capybara SmI, the great majority of the somatic sensory representation concerns the face, and the most proeminent contribution is from the mobile grasping upper lips and the furry buccal pad of the upper lip [Campos and Welker, 1976]. Agoutis also have this pad, but do not have an extensive neocortical representation of it.
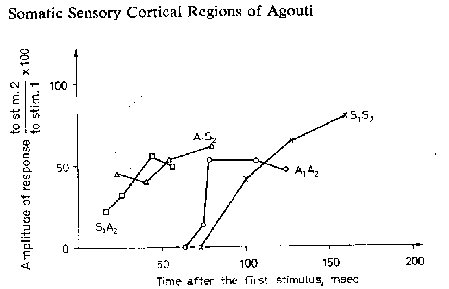
Table I. Mean latencies (msec) with standard errors of the onset (initial deflection) of cortical evoked potentials, after electrical stimulation, for area SmII from contra- and ipsilateral receptive fields (RF)
RF |
Contra | n | Ipsi | n |
Head and face |
8.91 +/- 0.41 | 11 | 13.55 +/- 0.49 | 11 |
Forelimb |
12.67 +/- 1.04 | 9 | 20.44 + /-1.06 | 9 |
Trunk |
13.50 +/- 1.50 | 2 | 20.00 +/- 0.00 | 2 |
Hindlimb |
13.00 | 1 | 16.00 | 1 |
All points |
10.96 +/- 0.61 | 23 | 16.91 +/- 0.85 | 23 |
n = Number os latencies measured |
||||
Conversely, the representation of the capybara forelimb is no greater than that of the hindlimb and thus proportionately less than in the agouti, The capybara life-style may well be more oriented to discriminative use of the lips, and that of agoutis to discriminative use of the forepaw, particularly the radial surfaces and the small but sensitive first digit which hold objects against the teeth and mouth (see fig. 6). We have observed captive agoutis carefully burying edible items and retrieving them at a later time.
As in agoutis, an anteroposterior sulcus transects SmI in capybaras, but in agoutis it separates the hindlimb representation from that of the forelimb (an interbrachial sulcus in the terminology of Johnson et al. [1973]), while in capybaras it separates the representation of the forelimb from that of the face (a jugular sulcus). Thus the ‘expanded’ forepaw representation in agoutis has a signal correlate in external brain morphology. Recent studies [Sur et al., 1978; Nelson et al., 1979] of sensory projections to cerebral cortex in another hand using herbivorous rodent, the grey squirrel, also show enlarged and differentiated forepaw projections. This represents an evolutionary convergent cerebral efflorescence in different rodent families related to behavioral adaptations.
SmII Region of agouti
Our data from agoutis, although consisting of evoked slow wave responses, shows the orientation of SmII in agreement with that found in several recent studies using unit spike responses, in cats [Haight, 1972], sheep [Johnson et al., 1974], raccoons [Herron, 1978], llamas [Welker et al., 1976], opossums [Pubols, 1977], and grey squirrels [Nelson et al., 1979]. In this orientation, the representations of the distal parts of the limbs point away from SmI, in decided contrast to several earlier reports of SmII representations which have the limb apices pointing towards SmI,e-g- in dogs [Pinto-Hamuy et al., 1956], porcupines [Lende and Woolsey,1956], squirrel monkeys [Benjamin and Welker, 1957], cats [Woolsey,1958] and rats [Welker and Sinha, 1972]. All but the last of these studies used evoked slow wave responses. The presence of this unit spike study among the slow wave studies (as our evoked slow wave study stands among the other unit spike results) suggests that a simple methodological difference is not the only source of these conflicting results. Nor is it reasonable to suppose that at some time in 1972 the orientation of SmII in all mammals was reversed; in 1943, Adrian found the apices of the limbs represented at the posterior edge of the anterior suprasylvian sulcus, presumably the rest of the goat SmII is in the sulcal wall toward the SmI face representation.
In dealing with these conflicting results, the findings of Bodemer and Towe [1963] may be instructive. In SmI in opossums, they obtained two different and opposed maps of projections from the hand. One map, showing the tips of the digits pointing posteriorly, was obtained by mapping the evoked potentials of highest amplitude, which is the method used in all the slow wave studies we have cited thus far. The opposing map, with the tips of the digits pointing anteriorly, came from plotting the evoked potentials of shortest latency; they hypothesized that this map reflected the site of first arrival of afferent activity and in fact this map corresponded to that later obtained using unit spikes [Pubols et al., 1976]. The peak-amplitude map could represent later-developing activity, including pre- and postsynaptic potentials that do not necessarily result in unit spikes. For projections of cat vibrissae in sensory cortex, Dykes et al., [1977] also reported radically different loci of foci of potentials when different parameters (e.g., peaks vs. latency) are plotted.
Other factors that must be considered in dealing with varying maps include the possibility of species-specific small, replicated projections of certain receptor surfaces [Paul et al., 1972; Kaas et al., 1976; Pubols et al., 1976; Sur et al., 1978; Weller et al., 1976; Merzenich et al., 1978], and variation from specimen to specimen of the projection of a given receptive field such as that documented by Dykes et al. [1977].
Rather than further attempts to ascertain the siting of some idealized ‘true’ representation, a more fruitful way to explore the significance of the discrepancies reported is to determine the sources, temporal and spatial sequences, and functional significance, of the evoked slow wave phenomena [Dykes et al., 1977]. It is likely that slow waves ean yield information not available from unit spike data. In SmII a good example of this may be seen in the bilateral activation of evoked slow waves but not of single units.
Carreras and Andersson [1963] noted that the bilaterality of receptive fields activating slow wave responses in SnrII was greatly reduced or absent when unit spike responses were observed. Whitsel et al. [1969] ascribed this phenomenon to the susceptibility of small neurons in SmII to general anesthetics; they found many bilaterally activated unit responses in SmII when general anesthetic effects were removed. Regardless of the mammalian species being studied, experiments using general anesthesia and evoked slow waves, including the present study, and, [e.g., Woolsey and Fairman [1946], Lende and Woolsey [1956], Pinto-Hamuy et al.[1956] and Zeigler [1964] have found a preponderance of bilateralprojections to SmII, while most experiments using anesthesia and unit spike responses have found mainly contralateral projections [e.g., Haight, 1972; Welker and Sinha 1972; Johnson et al., 1974; Herron, 1978]. This constitutes support not only for the suggestion of Whitsel et al. [1969], but also for the use of slow wave responses in microelectrode experiments. The evoked slow wave may be a valid index of sensory input in anesthetized preparations: the slow waves may be telling us what the anesthetized units cannot. Use of penetrating microelectrodes to record the evoked slow waves does increase the precision (fig. 3B) and decrease theapparent size of sensory representations compared to those obtained using large surface macroelectrodes (fig. 4A).
A similar argument can be made for the use of evoked slow waves in studying overlap between projection fields of different sensory modalities. Rather than being due only to volume conduction from a distant locus of activity, slow waves may represent neural activity that does not produce action potentials in cortical neurons; it may be subthreshold excitatory or inhibitory membrane polarization, but is a real effect of afferent input nevertheless. Carreras and Andersson [1963] presented single unit data supporting the validity of the overlap of auditory and somatic sensory projections to SmII. The problem of whether evoked slow waves represent volume-conducted signals from a distant locus and thus give the erroneous appearance of overlap, or whether they represent some set of influences at a given locus, can be resolved only by identification of the mechanism responsible for their generation.
Analyzing the relative extent of projections from different body parts in SmI and SmII shows some interesting contrasts. Welker and Sinha [1972] remarked on the absence of an enlarged face representation in SmII in rats, in decided contrast to the very large face region in SmI. The same is true in sheep [Johnson et al., 1974]. But in raccoons, Herron [1978] found a greatly enlarged forepaw region in SmII even more pronounced than that seen in SmI; and the situation was similar in cats for the limb representations [Haight, 1972]. As measured in agoutis, and in all the other animals studied, so far as we can determine by inspection of the published data, the face representation in SmII occupies a smaller proportion of the sensory region than does its counterpart in SmI. Conversely, the trunk and limb representations are a larger proportion of SmII than their counterparts in SmI. In agoutis, the enlargement of the hand area seen in SmI is also seen in SmII; however, the enlargement of the SmI face area is not. This absence of a large face region in SmII appears to hold true across species, regardless of the behavioral and neural specializations of the diverse body parts and their projections to sensory neocortex that are characteristic of the various species studied. It might be hypothesized, on the basis of the proportions of face and postcranial projections to SrnII, that the SmII region has some special function, involving projections from receptive fields on the body and particularly on the limbs more than projections from the face.
We found a greater proportion of evoked slow wave responses to deep stimuli (65%) in SmII than in SmI, including in SmI both slow wave and unit spike responses. Mountcastle et al. [1952] found that the cortical loci of evoked slow waves maximally activated by deep stimuli were situated in SmII in cats. Using unit spike responses in cats, Carreras and Andersson [1963] found 28% of SmII responses were to deep stimuli, and Haight [1972] reported only 6% of SmII units responding to deep stimulation. This may be another case where evoked cortical slow wave activity yields information not available from unit spike responses.
Sulcal Boundaries of Sensory Projections around Agouti
Despite the paucity of convolutions in the agouti forebrain, it still shows some neocortical sulci demarcating sensory projection fields, as has been documented for more gyrencephalic species [Welker and Campos,1963; Johnson et al., 1973]. The sulcus separating the forelimb from the hindlimb projections fin agouti SmI has been called the posterior end of the coronal sulcus [Friant, 1945]; it could as well or better be designated the intrasomatic sensory sulcus [Campos. and Welker, 1976] or the interbrachial sulcus [Johnson et al., 1973]. One other sulcus related to sensory projections is occasionally present in agouti brains: it bounds the SmII region posterolaterally and corresponds to a spur of the ectosylvian sulcus [Friant, 1945], the somatic-auditory sulcus in capybaras and guinea pigs [Campos and Welker, 1976] and the supra-auditory sulcus in wombats [Johnson et al., 1973].
Questions of Encephalization and the Relative Extents of SmI and SmII about rodents and mammals
Our finding of mainly higher threshold responses in SmII was also reported by Mountcastle et al. [1952], Carreras and Andersson [1963], and Whitsel et al. [1969]; but was contradicted by Haight [1972], Welker and Sinha [1972] and Herron [1978]; and the question is complicated by the suggestion of Carreras and Andersson [1963], Whitsel et al. [1969] and Haight [1972] that SmII includes two separate regions receiving projections of different modalities from at least two different thalamic regions. The ideas persist, however, that SmII has some special role in processing information derived from high threshold and noxious stimuli [Biemond, 1956; Mountcastle, 1968, p, 1442; Lende et al., 1971].
This idea fits with another supposition, based upon its location and cytoarchitecture, that SmII is a phylogenetically more ancient structure than SmI [Woolsey and Fairman, 1946; Sanides, 1969]: a response mechanism dealing with noxious stimulation could be considered more basic and necessary to survival than the light touch modalities supposedly more prevalent in SmI which according to this extended speculation is more recently evolved for fine and detailed somatic sensory discrimination. One might then argue that a greater extent of SmI, compared to that of SmII, in the brain of a given species is an index of the degree of evolutionary advance of that species. AJnong rodents, agoutis have a large SmII compared to the size of SmI (0.312, see table II) and thus could be regarded as evolutionary retardates. However, among primates, man also has a relatively large SmII/SmI ratio (0.318) and such a notion of evolutionary deficiency does not sit well with an anthropocentric view of evolutionary processes.
Dialectic salvation can be secured by considering encephalization as an independent index of evolutionary advance, since humans (among primates) and agoutis (among rodents) score highly in this rating. This line of thought led us to the observation that the SmII/SmI ratio in rodents is significantly (p <0.05) positively correlated (r = 0.75) with the coefficient of encephalization measured by the Dubois index [Friant, 1945] as can be seen in table II, (both populations are normal , p<0.005). Within
Table II. Comparison of the extent of SmII relative to that of Sml and Dubois index of encephalitation among certain mammals
| SmII/Sml ratio | Dubois index [Friant, 1945] |
Animal | Source |
| 0.079 | 0.08 | rat | Welker and Sinha, 1972 |
| 0.139 | 0.08 | rat | Woolsey, 1952 |
| 0.110 | 0.11 | guinea pig | Zeigler, 1969 |
| 0.143 | 0.11 | guinea pig | Campos and Welker, 1976 |
| 0.114 | 0.21 | capybara | Campos and Welker, 1976 |
| 0.325 | 0.21 | porcupine | Lende and Woolsey, 1956 |
| 0.312 | 0.27 | agouti | this study |
| 0.125 | marmoset | Woolsey, 1952 | |
| 0.279 | macaque | Woolsey, 1958 | |
| 0.325 | squirrel monkey | Benjamin and Welker, 1957 | |
| 0.368 | man | Penfield and Roberts, 1959 |
For animals other than agoutis, the areas of SmI and SmII used for calculating the ratios were derived planimetrically from the figures and scales presented in the published sources. The Dubois index (K) is the ratio of the weight to body weight raised to an exponential value.
this mammalian order larger brains have a relatively larger SmII region. In primates, similar relations appear to hold, although the numerical encephalization index is not available. One can then speculate that ‘advanced’ animals have better reactions (using SmII) to noxious situations, if one agrees that more encephalized animals within a given order have better ability in surviving [Ariens Kappers, 1947, p. 545].
Noting the eminent success of rats and mice in the survival game, however, one might also argue that smaller brains and a lower SmII/SmI ratio might ultimately prove more efficient, more beneficial and be considered the more evolutionarily ‘advanced’. The progress of the marmosets in this regard in the near and distant future might be very interesting in the light of these arguments.
In truth, no single feature, not encephalization, nor the SmII/SmI ratio, nor the capacity for flight or for speech, is the key to evolutionary success. It is combinations of these characteristics with a multitude of others that gives an animal a selective advalltage in its particular set of circumstances at a given place and fitrrte [e.g. Guns, 1969]. SmII, whatever it is or does, apparently is useful to most if not all mammals and thus it persists in its entirety even when parts of SmI do not [Johnson et al., 1974]. The relation of its relative extent to relative brain size in two orders of mammals can only be noted at this time. It neither has, nor is, an explanation as yet.
Acknowledgements
This research was supported by funds from the Rockefeller Foundation, the Research Council of UFMG, and NSF research grant GB 43236. Animals were obtained through the generous cooperation of Prof. O. Gonçalves Lima, and Mr. G. Fernandes. The authors are grateful to P. S. Beirão for assisting in recording experiments. Animal photographs were taken courtesy of Dr. R.C. Switzer, NIMH, Dr. Ervin J. Baas, and Robert Wolfe, NIH Animal Center, and Barbara Bailey and Robert Reese, The Salisbury Zoo, Salisbury, MD, S. H. Graham, Director.
References
| <<voltar |
PESQUISA > Peixe elétrico, caramujo e mamíferos > Link 12 > |